
The Balmer series of hydrogen produces visible spectral lines at 656.3, 486.1, 434.0, and 410.2 nm.
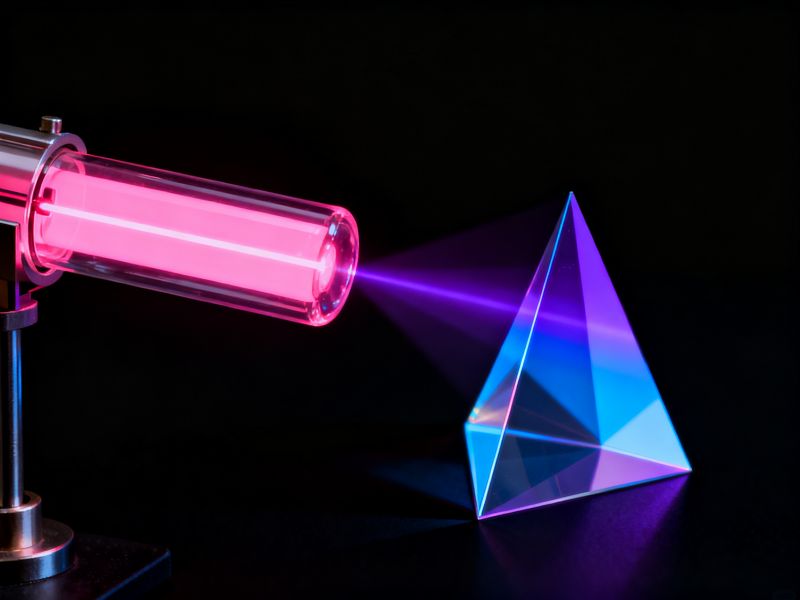
he Balmer series is not a textbook abstraction. It is a set of visible spectral lines—H-alpha at 656.3 nm, H-beta at 486.1 nm, H-gamma at 434.0 nm, and H-delta at 410.2 nm—that appear when hydrogen gas is excited in a discharge tube. I have seen these lines in a simple prism spectroscope, and they are unmistakable: a sharp red line, a blue-green line, and two fainter violet lines. Their spacing follows a pattern that Johann Balmer, a Swiss schoolteacher, captured in 1885 with a remarkably simple formula: λ = B * n² / (n² - 4), where B = 364.56 nm and n = 3, 4。5, ... This empirical fit predated any physical explanation by nearly three decades.What makes the Balmer series scientifically significant is its role as a direct test of quantum mechanics. Niels Bohr's 1913 model predicted the Balmer formula from first principles, deriving B = 4 / R, where R is the Rydberg constant. The agreement between measured wavelengths and Bohr's prediction was stunning—to within 0.1% for H-alpha. Later。quantum electrodynamics introduced tiny corrections (the Lamb shift), and measurements of Balmer lines in astrophysical plasmas now serve as precision probes of fundamental constants. For example, the H-alpha line width in solar flares reveals electron density and temperature, while its Doppler shift tracks plasma flows. The Balmer series is not just a historical curiosity;it is a workhorse diagnostic in modern astronomy.In practical terms, the Balmer series appears wherever hydrogen is partially ionized and recombining. In a fluorescent lamp, mercury vapor dominates, but hydrogen impurities produce faint Balmer emission. In stellar spectra, the Balmer lines are strongest in A-type stars (roughly 7500–10000 K), where hydrogen is mostly neutral but excited. I once analyzed a low-resolution spectrum of Vega and found H-beta and H-gamma clearly visible。broadened by stellar rotation. That broadening—about 0.2 nm for Vega—tells you the star spins at roughly 20 km/s. The Balmer series thus encodes both atomic physics and stellar kinematics.One subtlety often overlooked: the Balmer series is a series of transitions to the n=2 level。
not to the ground state. This means the lines are optically thin in many laboratory plasmas, so self-absorption is minimal. That property makes Balmer lines reliable for temperature diagnostics via line ratios, such as H-alpha/H-beta. In dense plasmas, however, Stark broadening becomes significant—H-beta is particularly sensitive to electron density, which is why it is a standard diagnostic in fusion research. I have seen H-beta profiles in a tokamak edge plasma that were so broadened that the line nearly merged with the continuum. That is not a failure of the Balmer model;it is the model working exactly as intended.The Balmer series remains a gateway to atomic spectroscopy for students and a precision tool for researchers. Its lines are easy to observe, its formula is simple。
and its quantum interpretation is clean. Yet it still yields surprises—recent laboratory measurements of the Balmer-alpha line in ultracold hydrogen have tested QED to parts-per-trillion precision. For anyone learning spectroscopy, the Balmer series is the first real spectrum to master. For anyone doing plasma diagnostics, it is often the last word on density and temperature. That dual role—pedagogical and practical—explains why the Balmer series has stayed relevant for over a century.